Vasudev, Anusha; Moore, Colin R.; Calindi, Aparna; Kang, Seung-woo; Helm, Bryan R.; Srinivasan, Jayashree; Shah, Siddhartha; Zong, Ruiting; Singarapu, Nandini; Casey, Scott; Macintyre, Andrew N.; Lau, Ken S.; Hale, Laura P.; Liu, Qi; Manley, Nancy Ruth; Ehrlich, Lauren I. Richie; & Richie, Ellen Rothman. (2025).泭.泭Cell Reports,泭44(12), 116677.泭
Perinatal T cells have unique features that may be shaped by changes in the thymus���s supporting stromal cells. In mice, researchers studied thymic cells from birth to one month using gene profiling, flow cytometry, and imaging. They found major changes around 7���14 days, when the thymus shifts from growth to maintenance. During this time, genes for cell growth decrease, while genes for immune signaling increase. These changes are linked to higher T cell self-reactivity and stronger regulatory T cell function. Overall, the thymus remodels during this transition, which likely affects how T cells develop. The data also provide a resource for studying the perinatal thymus.
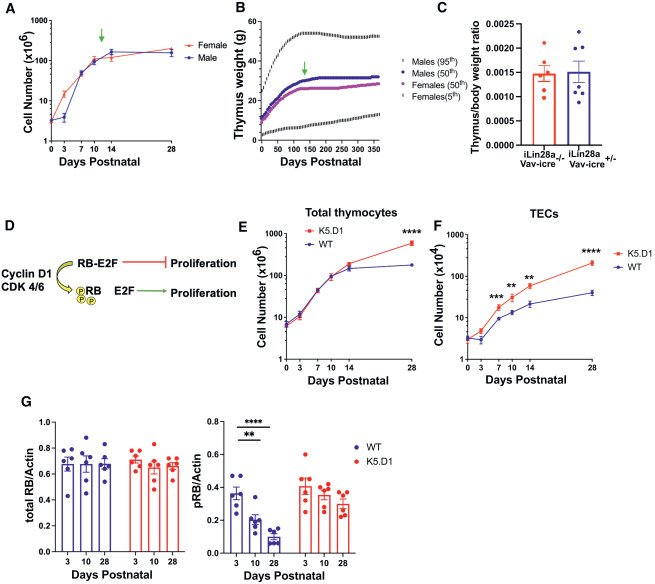
Figure 1泭Cyclin D1-RB-E2F pathway regulates the transition from perinatal thymus expansion to juvenile homeostasis
(A) Thymocyte cellularity (mean 簣 SEM) in male versus female C57BL/6J mice. Green arrow indicates the transition from thymus growth to homeostasis. Data compiled from ���3 experiments/age.泭n泭= 2���14 mice/sex/age.
(B) Human thymus weight based on previously published percentile charts.泭Thymus weight at 50th泭percentile males (blue) and females (pink); thymus weight at 95th泭(males) and 5th泭percentile (females).泭n泭= 563 males; 407 females.
(C) Thymus to body weight ratio (mean 簣 SEM) in 5-week-old Vav-iCre+/���;R26iLin28a mice and Vav-iCre���/���;R26iLin28a controls,泭n泭= 6���7 mice/genotype. Statistical analysis performed using unpaired泭t泭test,泭���p泭< 0.05,泭������p泭< 0.01,泭���������p泭< 0.001, and泭������������p泭< 0.0001.
(D) Simplified schematic of cyclin D1-RB-E2F axis.
(E and F) Total thymocyte (E) and TEC cellularity (F) (mean 簣 SEM) in WT and K5.D1 mice. Data pooled from ���3 experiments/age group;泭n泭= 9���32 mice/genotype/age.
(G) Quantification (mean 簣 SEM) of western blot data showing the ratio of total or phosphorylated RB (pRB) to actin in WT and K5.D1 TECs. Each dot represents one experiment; 3 mice/experiment; 6 independent experiments/age/genotype.
For泭A, 1E, and 1F, statistical analysis used multiple泭t泭tests; unpaired泭t泭test per age group with Holm-��穩d獺k method.泭G used one-way ANOVA with Tukey���s multiple comparisons test.泭���p泭< 0.05,泭������p泭< 0.01,泭���������p泭< 0.001, and泭������������p泭< 0.0001.